As part of decommissioning the Core Web Vitals report from Lighthouse, here’s how the CrUX report has been built.
If you are wondering why am I removing these features, here’s why – I never used them in a real-life scenario when optimizing a website. Also, it’s inconsistent. For low traffic websites, it might not be available. Also, it requires a pretty convoluted setup. I want to implement a pagespeed testing process that works out of the box, zero configuration required.
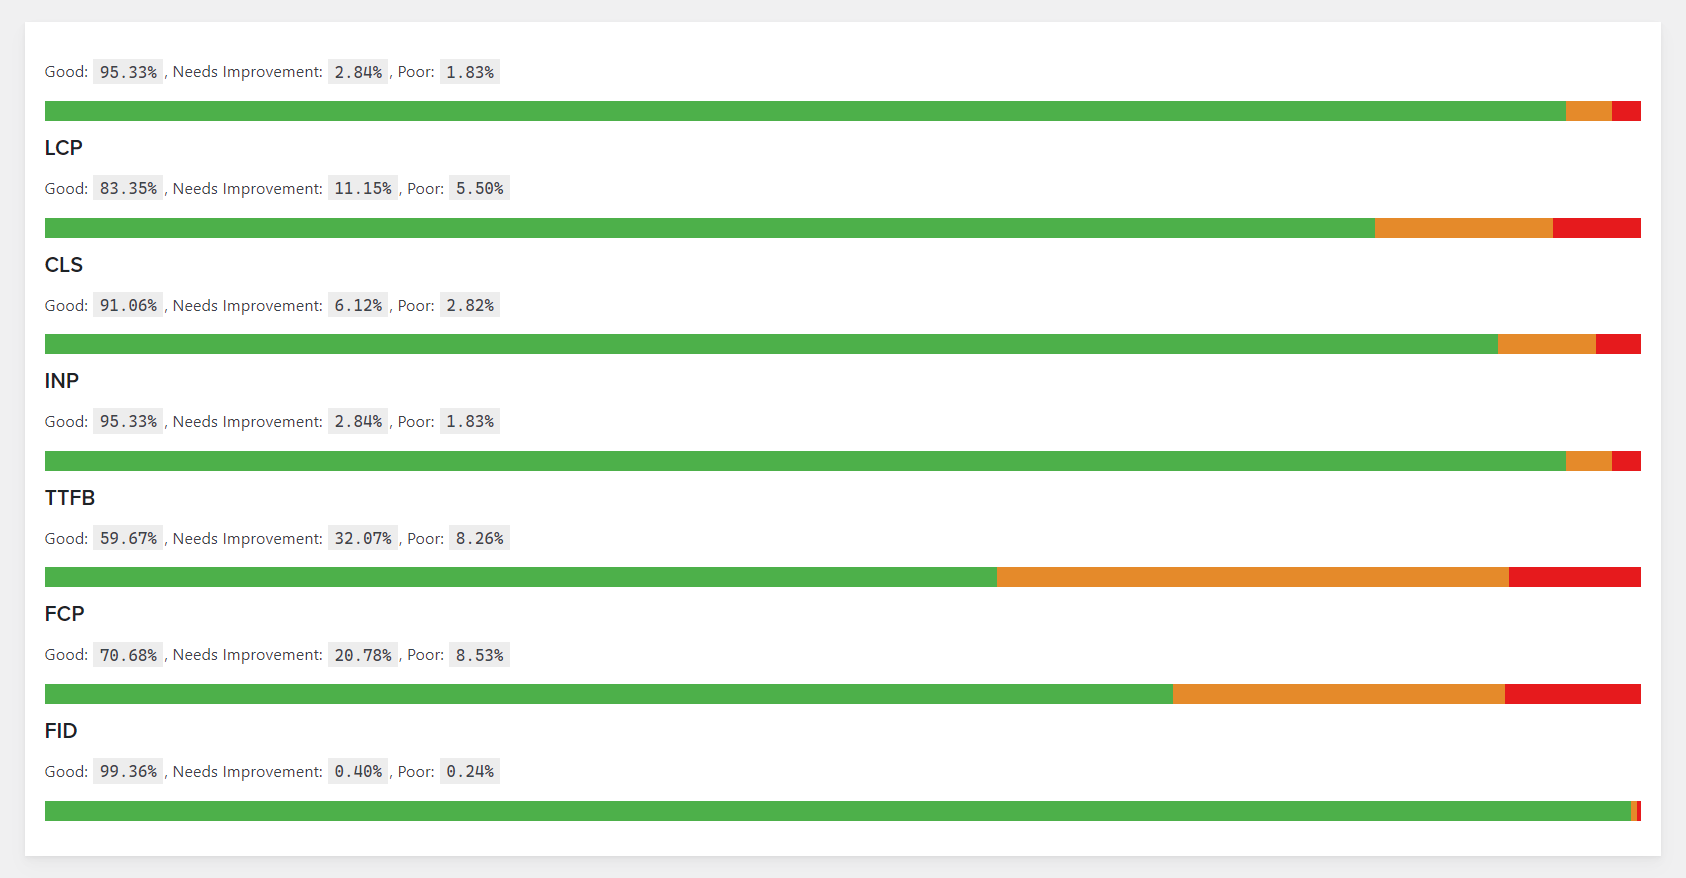
The Chrome User Experience Report provides user experience metrics for how real-world Chrome users experience popular destinations on the web.
The Chrome User Experience Report is powered by real user measurement of key user experience metrics across the public web, aggregated from users who have opted-in to syncing their browsing history, have not set up a Sync passphrase, and have usage statistic reporting enabled.
First, we need a container to add the report to:
<div id="lhf-crux-wrapper" data-origin="https://www.example.com/"></div>Next, we need to style the containers:
/**
 * CrUX
 */
#lhf-crux-wrapper {
    margin: auto;
    width: 100%;
}

#lhf-crux-wrapper h2 {
    font-size: 18px;
    margin: 0;
    padding: 0;
}
#lhf-crux-wrapper p {
    text-transform: capitalize;
}

#lhf-crux-wrapper .grid-container {
    display: grid;
    grid-template-rows: 16px;
    grid-template-areas: ". . .";
    padding: 0 0 12px 0;
}

.box-good {
    background-color: hsl(118, 41%, 49%);
}
.box-needs-improvement {
    background-color: hsl(31, 78%, 53%);
}
.box-poor {
    background-color: hsl(359, 80%, 50%);
}
And last, the most important part, the JavaScript code:
// Gather the data for example.com and display it
if (document.getElementById('lhf-crux-wrapper')) {
    const CrUXApiUtil = {
        /**
         * Query the CrUX API for metric records
         * @param {{origin?: string, url?: string, formFactor?: string,  metrics?: Array<string>}} requestBody
         * @param {string} apiKey
         * @return {{record: {key: Object, metrics: Map<string, {histogram: Array<{ start: number, end?: number, density: number}>}>}, urlNormalizationDetails: Object}}
         */
        query: async function (requestBody, apiKey) {
            const endpointUrl = "https://chromeuxreport.googleapis.com/v1/records:queryRecord";
            const resp = await fetch(`${endpointUrl}?key=${apiKey}`, {
                method: "POST",
                body: JSON.stringify(requestBody),
            });
            const json = await resp.json();

            if (!resp.ok) {
                throw new Error(json.error.message);
            }

            return json;
        }
    };

    (async function () {
        const origin = document.getElementById('lhf-crux-wrapper').dataset.origin;

        const json = await CrUXApiUtil.query({origin: origin}, "Your Google Lighthouse API Key");
        // console.log("CrUX API response:", json);

        const labeledMetrics = labelMetricData(json.record.metrics);

        // Display metric results
        for (const metric of labeledMetrics) {
            const metricEl = document.createElement('section');

            const titleEl = document.createElement('h2');
            titleEl.textContent = metric.acronym;

            const [descEl, barsEl] = createDescriptionAndBars(metric.labeledBins);

            metricEl.append(titleEl, descEl, barsEl);
            document.getElementById("lhf-crux-wrapper").append(metricEl);
        }
    })();
}

/**
 * Utility method to transform the response"s metric data into an array of usable metric objects
 * Example return value:
    [
        {
            "acronym": "FCP",
            "name": "first_contentful_paint",
            "labeledBins": [{
            "label": "good",
            "percentage": 43.51,
            "start": 0,
            "end": 1000,
            "density": 0.4351
        }, // ... (other bins) ]
    }, // ... (other metrics) ]
 *
 * @return {{acronym: string, name: string, labelsBins: Array<{label: "good"|"needs improvement"|"poor", percentage: number, start: number, end?: number, density: number}>}}
 */
function labelMetricData(metrics) {
    const nameToAcronymMap = {
        first_contentful_paint: "FCP",
        largest_contentful_paint: "LCP",
        first_input_delay: "FID",
        cumulative_layout_shift: "CLS",
        experimental_time_to_first_byte: "TTFB",
        experimental_interaction_to_next_paint: "INP"
    };

    return Object.entries(metrics).map(([metricName, metricData]) => {
        const standardBinLabels = ["good", "needs improvement", "poor"];
        const metricBins = metricData.histogram;

        // We assume there are 3 histogram bins and they"re in order of: good => poor
        const labeledBins = metricBins.map((bin, i) => {
            // Assign a good/poor label, calculate a percentage, and add retain all existing bin properties
            return {
                label: standardBinLabels[i],
                percentage: bin.density * 100,
                ...bin,
            };
        });

        return {
            acronym: nameToAcronymMap[metricName],
            name: metricName,
            labeledBins,
        };
    });
}

// Create the three bars w/ a 3-column grid
// This consumes the output from labelMetricData, not a raw API response.
function createDescriptionAndBars(labeledBins) {
    const descEl = document.createElement("p");

    // Example: "good: 43.63%, needs improvement: 42.10%, poor: 14.27%"
    descEl.innerHTML = labeledBins
        .map(bin => `${bin.label}: <code>${bin.percentage.toFixed(2)}%</code>`)
        .join(", ");

    let barsEl = document.createElement("div");

    for (const bin of labeledBins) {
        const barEl = document.createElement("div");

        // Reuse the label for the styling class, changing any spaces:  `needs improvement` => `needs-improvement`
        barEl.classList.add(`box-${bin.label.replace(" ", "-")}`);

        // Add tooltip to share the size of each bin
        barEl.title = `bin start: ${bin.start}, bin end: ${bin.end}`;
        barsEl.append(barEl);
    }

    // Set the width of the bar columns based on metric bins
    // Ex: `grid-template-columns: 43.51% 42.26% 14.23%`;
    barsEl.style.gridTemplateColumns = labeledBins.map(bin => `${bin.percentage}%`).join(" ");
    barsEl.classList.add(`grid-container`);

    return [descEl, barsEl];
}
Notes
Note that you need to add your own Google Lighthouse API key to this line:
const json = await CrUXApiUtil.query({origin: origin}, "Your Google Lighthouse API Key");Also note that you will need to keep an eye on the API and make any necessary changes, whenever a metric gets added, renamed or deprecated:
const nameToAcronymMap = {
    first_contentful_paint: "FCP",
    largest_contentful_paint: "LCP",
    first_input_delay: "FID",
    cumulative_layout_shift: "CLS",
    experimental_time_to_first_byte: "TTFB",
    experimental_interaction_to_next_paint: "INP"
};
Also note that the report shows the field data collected over the last 28 days.