Three Powerful Features to Transform Your Website Analytics
Active Analytics just got a major upgrade! We’re excited to introduce three game-changing features that make understanding your website visitors easier, more insightful, and more actionable than ever before.
Whether you’re a business owner looking to understand customer behavior, a developer implementing advanced tracking, or someone who simply wants better insights into their website—these new features are designed with you in mind.
Let’s dive into what’s new and how these features can help you make better decisions for your website.
1. Custom Events Tracking
What Are Events?
Think of events as milestones or actions that visitors take on your website. While traditional analytics tells you which pages people visit, event tracking tells you what people do on those pages.
For example:
- Did someone click your “Sign Up” button?
- Did they download your product brochure?
- Did they watch your promotional video?
- Did they submit a contact form?
These are all events—valuable interactions that help you understand visitor engagement beyond simple page views.
Why Events Matter
For Business Owners:
Events help you answer crucial questions like:
- Which call-to-action buttons are most effective?
- Are people actually downloading your resources?
- Which forms get the most submissions?
- What content drives the most engagement?
For Marketers:
Track conversion funnels, measure campaign effectiveness, and understand exactly where users drop off in your sales process.
For Developers:
Implement sophisticated tracking for any user interaction—from video plays to shopping cart additions—using a simple, Google Analytics-style API.
How Events Work
Event tracking in Active Analytics uses a simple JavaScript function that you can add to any element on your website:
// Track a button click
wpaa('send', 'event', {
    eventCategory: 'Button',
    eventAction: 'Click',
    eventLabel: 'Sign Up CTA'
});
For Non-Technical Users:
Don’t worry if code looks intimidating! Your developer can set this up once, and you’ll be able to view all the insights in your WordPress dashboard. No coding required to view the data!
What You Can Track
Common Use Cases:
- Button Clicks – See which CTAs get the most clicks
- Form Submissions – Track contact forms, newsletter signups, registrations
- Downloads – Monitor PDF downloads, brochures, resources
- Video Engagement – Know when people play, pause, or finish videos
- E-commerce Actions – Track product views, cart additions, purchases
- User Milestones – Login events, registrations, profile completions
- Content Interaction – Comments, shares, likes
- Scroll Depth – How far down the page do people read?
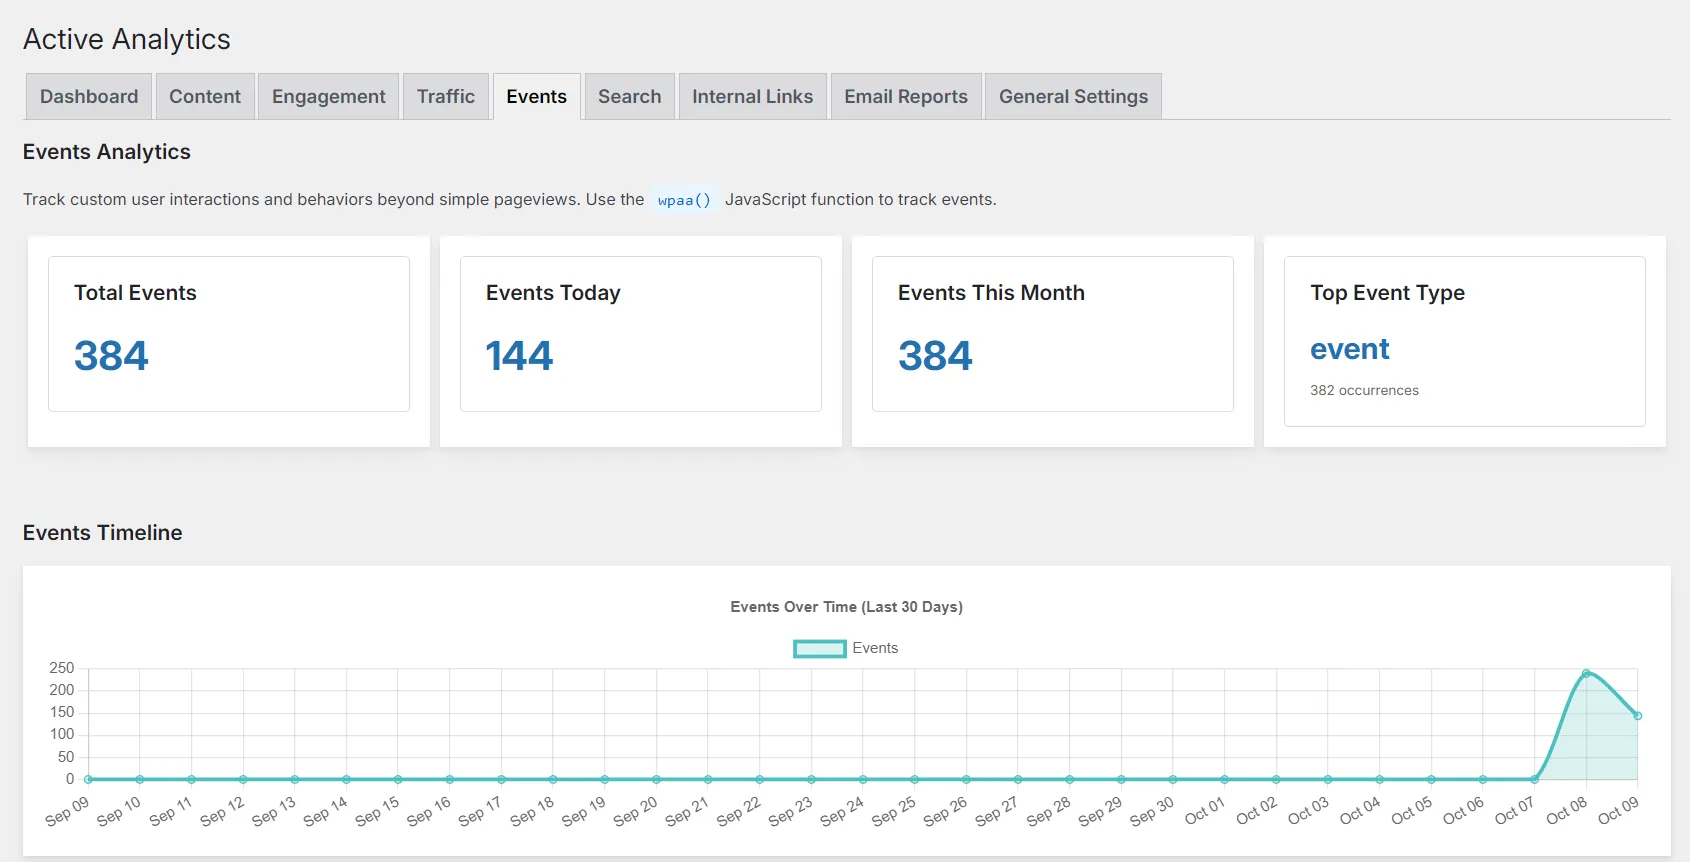
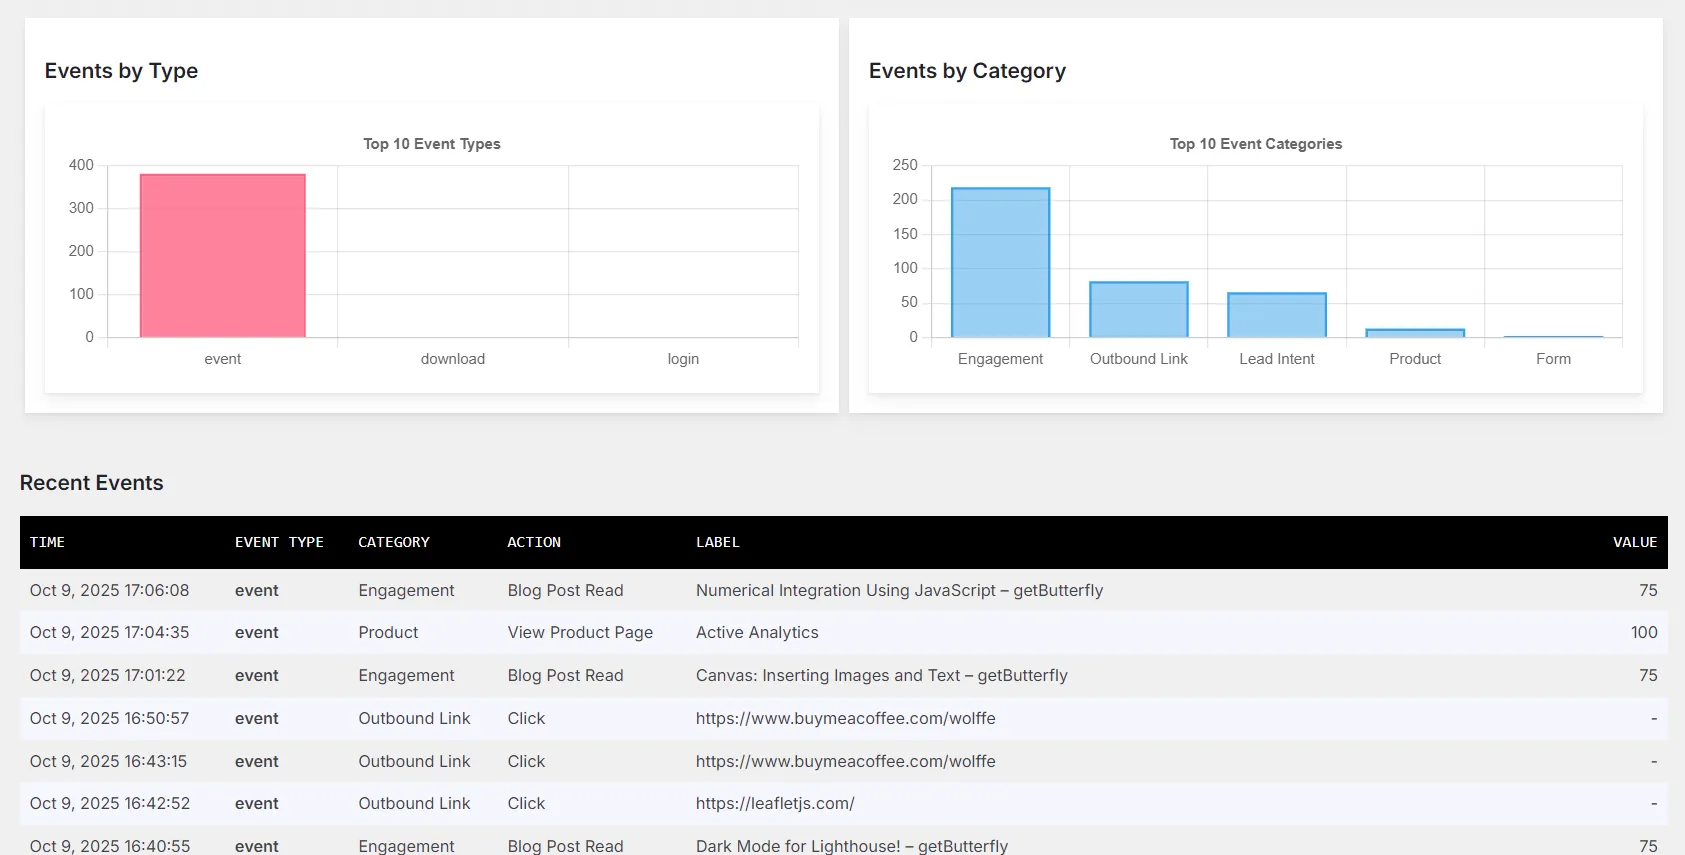
Events Dashboard
All your event data is beautifully visualized in the Active Analytics dashboard:
Visual Reports:
- Timeline Chart – See event trends over the last 30 days
- Event Type Chart – Which events are most common?
- Category Chart – How are events distributed across categories?
- Detailed Table – Every event with timestamp, URL, and details
Summary Statistics:
- Total events tracked
- Events today
- Events this month
- Top performing events
Privacy & Compliance
Events respect your privacy settings:
- Bot detection prevents fake data
- No personal information stored
- GDPR-friendly by design
- Respects data retention settings
- Works alongside pageview tracking
2. Automated Email Reports
What Are Email Reports?
Imagine getting a comprehensive analytics summary delivered straight to your inbox every month—without lifting a finger. That’s exactly what automated email reports do!
Email reports automatically compile your website’s key metrics and send them to you (and your team) on a schedule you choose.
Why Email Reports Matter
For Business Owners:
- Get insights without logging into WordPress
- Share performance data with stakeholders automatically
- Monitor website health at a glance
- Make data-driven decisions faster
For Agencies:
- Send white-label reports to clients automatically
- Keep clients informed without manual work
- Demonstrate value with regular updates
- Save hours each month on reporting
For Team Collaboration:
- Everyone stays on the same page
- Multiple recipients supported
- Perfect for remote teams
- No login credentials needed for stakeholders
What’s Included in Reports
Each email report contains:
Key Metrics:
- Visitors – How many unique people visited your site
- Pageviews – Total pages viewed
- Sessions – Number of visits
- Pages per Session – Engagement metric
- Percentage Changes – Compare to previous period
Detailed Insights:
- Top 10 Pages – Your most popular content
- Top 10 Referrers – Where your traffic comes from
- Traffic Channels – Direct, organic, social, referral breakdown
- Top Search Keywords – What people searched for on your site
- Top Events – Most tracked interactions (if events enabled)
Smart Comparisons:
Every metric shows percentage change compared to the previous 30 days, so you can spot trends immediately:
- ↑ 15% increase in visitors
- ↓ 5% decrease in bounce rate
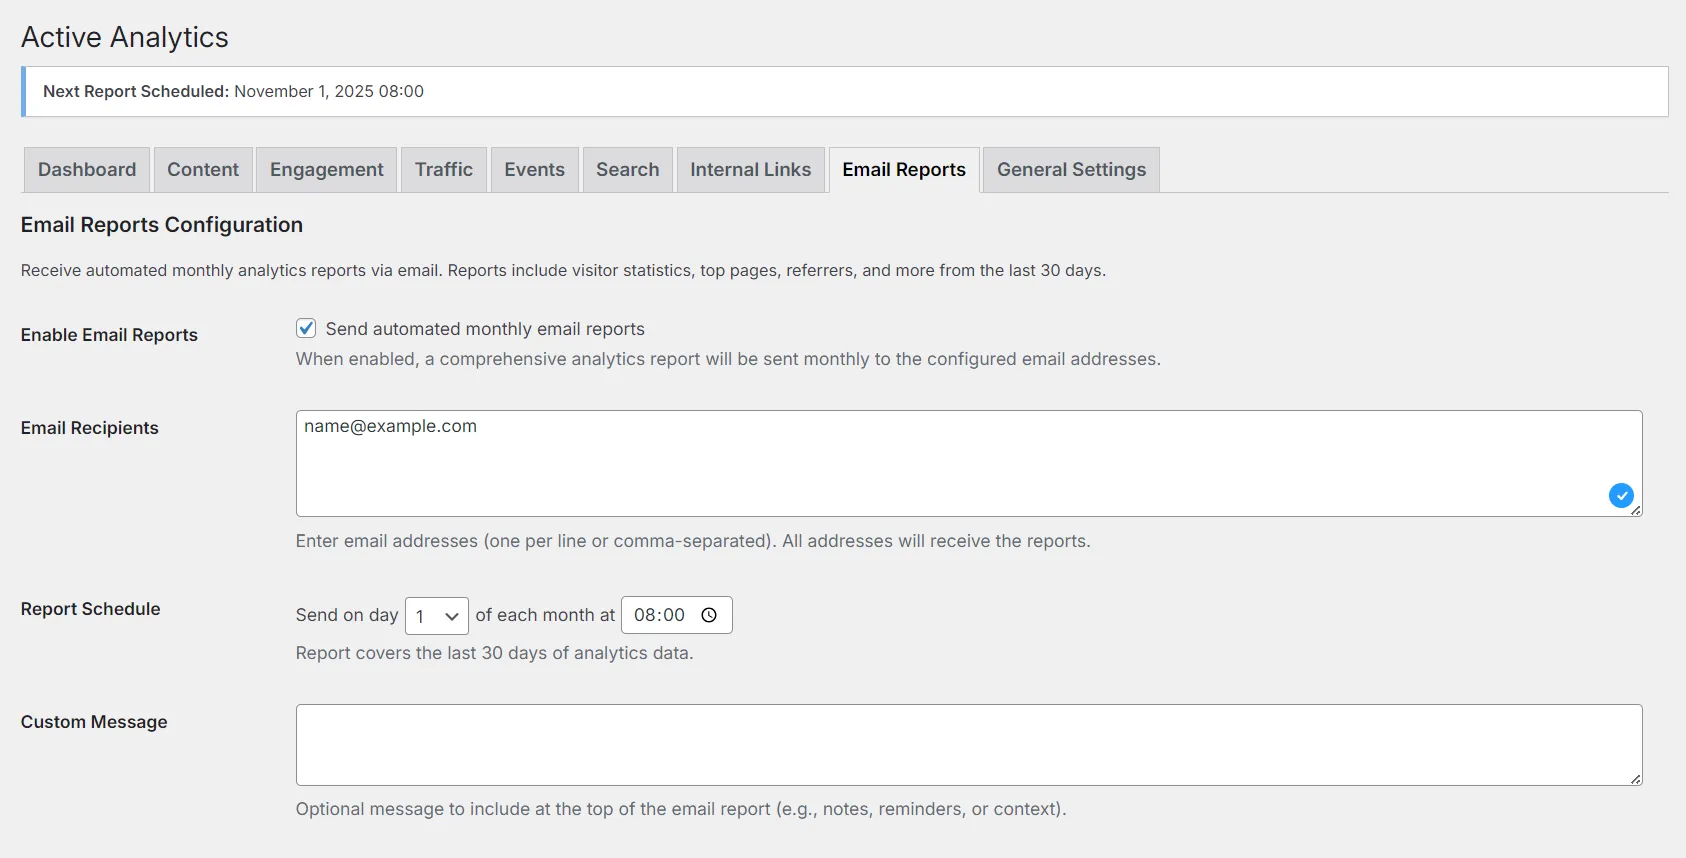
How to Set Up Email Reports
Step 1: Enable Reports
Go to Settings → Active Analytics → Email Reports and check “Enable Monthly Reports”
Step 2: Add Recipients
Enter email addresses (one per line) for everyone who should receive reports:
boss@company.com
marketing@company.com
developer@company.com
Step 3: Choose Schedule
Select how often you want reports sent:
- Daily
- Weekly
- Monthly (recommended)
Step 4: Customize (Optional)
Add a personal message that appears at the top of each report.
That’s it! Reports will be sent automatically. No maintenance required.
Test Before You Wait
Don’t want to wait a month to see what the report looks like? Use the “Send Test Report Now” button to receive a sample immediately!
Report Format
Reports arrive as beautifully formatted HTML emails:
- Clean, professional design
- Easy-to-read tables
- Color-coded trend indicators
- Mobile-friendly layout
- Direct link to full dashboard
Subject Line Example:
“My Awesome Website – Monthly Analytics Report: 5,234 visitors, 12,458 pageviews”
Who Should Use Email Reports?
Perfect For:
- Business owners who want weekly/monthly summaries
- Agencies managing multiple client sites
- Marketing teams tracking campaign performance
- Stakeholders who need visibility without WordPress access
- Anyone who prefers email over dashboard logins
3. Real-Time Visitor Monitoring
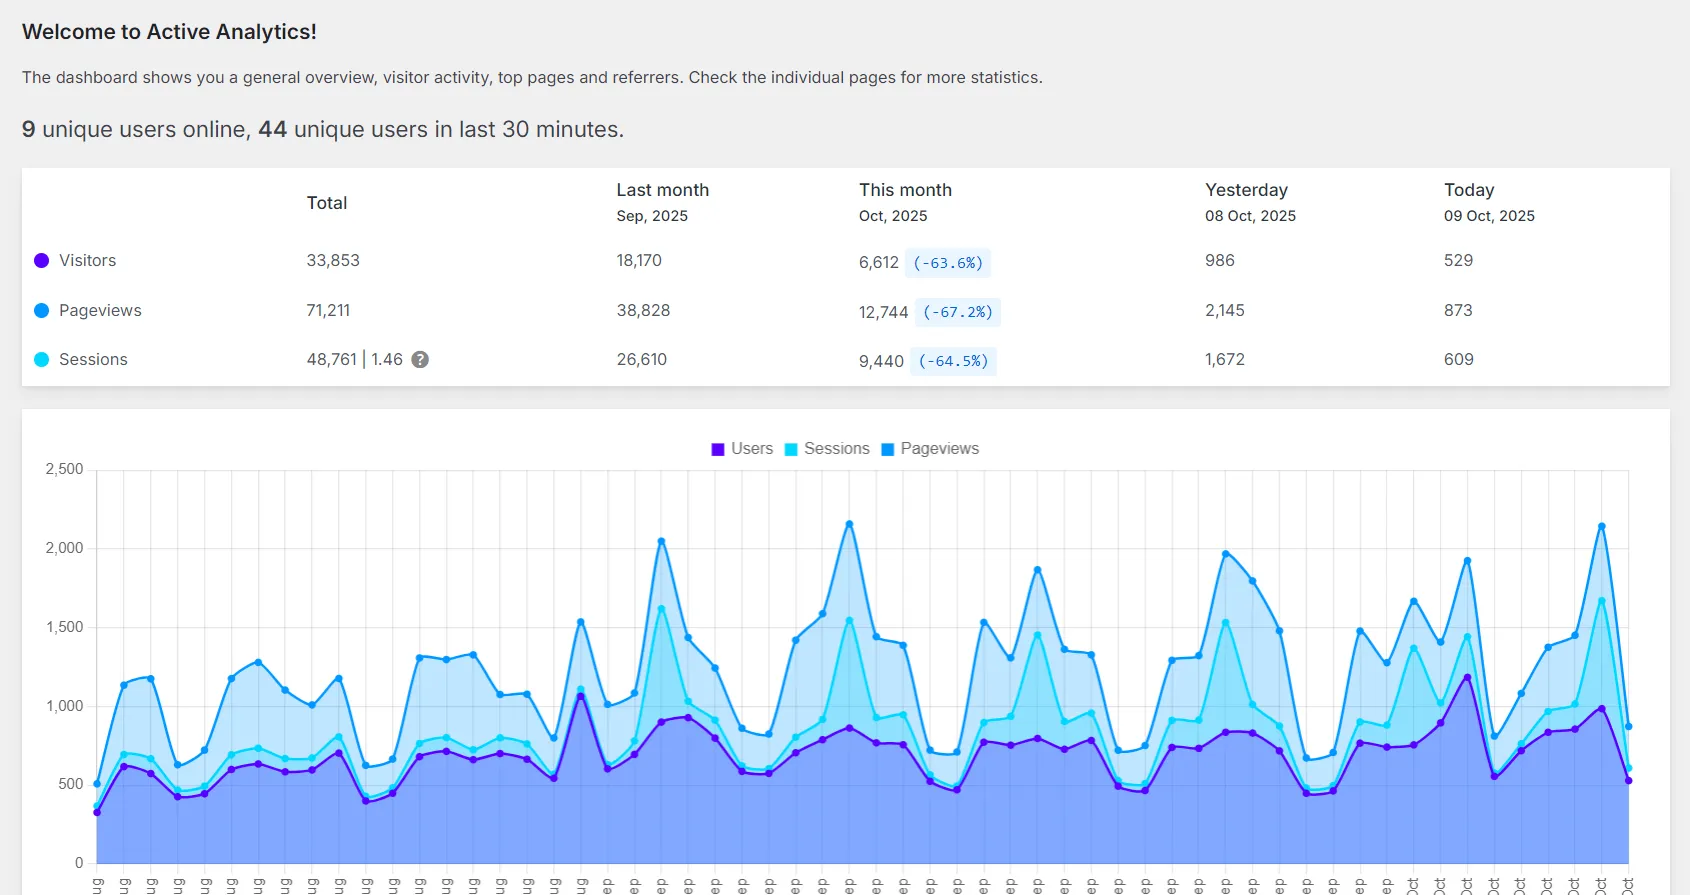
What Is Real-Time Monitoring?
Real-time visitor monitoring shows you who’s on your website right now and who was recently active. It’s like having a live dashboard of your website traffic.
You’ll see:
- Number of users currently browsing (last 3 minutes)
- Number of users active in the last 30 minutes
- Automatic updates every 30 seconds
Why Real-Time Monitoring Matters
For Business Owners:
- See immediate impact of marketing campaigns
- Monitor website during product launches
- Verify website is working during peak times
- Understand traffic patterns in real-time
For E-commerce:
- Watch sales events unfold live
- Monitor flash sale traffic
- See Black Friday surge in real-time
- React quickly to traffic spikes or drops
For Content Creators:
- See reactions to new content immediately
- Monitor social media referral spikes
- Track viral content as it happens
For Developers:
- Monitor website after deployments
- Verify fixes are working
- Check traffic during maintenance windows
How It Works
Real-time monitoring is automatic—no setup required! Just:
- Go to your Active Analytics Dashboard
- Look at the top of the page
- See live visitor counts that update every 30 seconds
Example Display:
4 unique users online, 19 unique users in last 30 minutesThe numbers will:
- Update automatically (no page refresh needed)
- Turn green briefly when they change
- Show smooth transitions
- Work silently in the background
What You Can Learn
Immediate Insights:
- Campaign Performance – Did your email blast drive traffic?
- Content Virality – Is your blog post being shared?
- Peak Traffic Times – When are most people online?
- Website Health – Is the site responding normally?
- Event Impact – How many people are attending your webinar?
Quick Reactions:
- Notice unusual traffic spike? Check your latest content
- See traffic drop? Investigate potential issues
- Peak hours identified? Schedule posts accordingly
- Campaign launched? Watch results in real-time
Technical Details (For Developers)
Real-time monitoring:
- Uses lightweight AJAX polling (30-second intervals)
- Minimal server impact
- Permission-protected (admin only)
- Works with existing session tracking
- No additional configuration needed
- Visual feedback on updates
Privacy & Performance
Privacy:
- Counts unique visitors only (anonymous)
- No personal data displayed
- IP addresses not shown in real-time view
- Respects your privacy settings
Performance:
- Lightweight queries
- Minimal database impact
- Efficient caching
- No impact on website speed
- Only updates when dashboard is open
Getting Started
Quick Setup Guide
Enable Events (Optional):
- Go to Settings → Active Analytics → Events
- Add tracking code to your site (see documentation)
- Start collecting event data
Set Up Email Reports:
- Go to Settings → Active Analytics → Email Reports
- Enable monthly reports
- Add recipient emails
- Send a test report
- Save settings
View Real-Time Visitors:
- Go to Settings → Active Analytics → Dashboard
- Look at the top section
- See live visitor counts (auto-updates every 30 seconds)
That’s it! All three features are now active.
Real-World Use Cases
Use Case 1: E-Commerce Store Owner
Challenge: Need to understand which products generate interest and track sales funnel.
Solution:
- Events: Track “Add to Cart” clicks and checkout completions
- Email Reports: Weekly reports showing top products and conversion rates
- Real-Time: Monitor traffic during sales events
Result: 25% increase in conversion by identifying and fixing drop-off points.
Use Case 2: Digital Marketing Agency
Challenge: Managing 20+ client websites, need efficient reporting.
Solution:
- Events: Track campaign-specific CTAs for each client
- Email Reports: Automated monthly reports to all clients
- Real-Time: Monitor campaign launches live
Result: Saved 10+ hours per month on manual reporting, happier clients.
Use Case 3: Content Publisher
Challenge: Want to know which content resonates with readers.
Solution:
- Events: Track scroll depth, video plays, and social shares
- Email Reports: Weekly content performance summaries
- Real-Time: See which articles go viral in real-time
Result: Better content strategy based on actual engagement data.
Use Case 4: SaaS Product Website
Challenge: Need to optimize trial signup flow.
Solution:
- Events: Track each step of signup funnel
- Email Reports: Monthly conversion metrics to team
- Real-Time: Monitor onboarding in real-time
Result: Identified bottleneck, improved signup rate by 40%.
Use Case 5: Non-Profit Organization
Challenge: Need to show donors the impact of their contributions.
Solution:
- Events: Track donation button clicks and form submissions
- Email Reports: Monthly reports to board members
- Real-Time: Monitor fundraising campaigns live
Result: Increased transparency and donor confidence.
Frequently Asked Questions
General Questions
Q: Do I need all three features?
A: No! Use what you need. Real-time monitoring works out-of-the-box. Events require setup. Email reports are optional.
Q: Will this slow down my website?
A: No. All features are optimized for performance with minimal server impact.
Q: Is this GDPR compliant?
A: Yes! All features respect privacy settings, don’t store personal data, and include bot detection.
Q: Can I use this with other analytics tools?
A: Absolutely! Active Analytics works alongside Google Analytics, Matomo, or any other tool.
Events Questions
Q: Do I need to be a developer to use events?
A: To set up events, basic JavaScript knowledge helps (or ask your developer). To view reports, no technical skills needed!
Q: How many events can I track?
A: Unlimited! Track as many events as you need.
Q: Can I track events on specific pages only?
A: Yes! Add the tracking code only to the pages you want to monitor.
Email Reports Questions
Q: How many recipients can I add?
A: Unlimited! Add as many email addresses as needed (one per line).
Q: Can I customize the report design?
A: The current design is optimized for readability. Custom designs may be available in future versions.
Q: What if I don’t want to wait for the scheduled report?
A: Use the “Send Test Report Now” button to receive a report immediately.
Q: Can I change the report schedule?
A: Yes! Choose daily, weekly, or monthly based on your needs.
Real-Time Questions
Q: How often does real-time data update?
A: Every 30 seconds automatically.
Q: Why 3 minutes and 30 minutes?
A: 3 minutes = currently browsing, 30 minutes = recently active. Two useful metrics!
Q: Does this work on mobile?
A: Yes! The dashboard is fully responsive.
Privacy & Data Protection
All three features are built with privacy in mind:
Events Tracking:
- No personal data stored
- Bot detection prevents fake data
- Session IDs are anonymous
- IP addresses can be anonymized
Email Reports:
- Data never leaves your server
- Sent via your WordPress installation
- No third-party services involved
- Recipients control subscription
Real-Time Monitoring:
- Anonymous visitor counts only
- No individual tracking
- Admin-only visibility
- No data exposed to visitors
GDPR Compliance:
- All features respect opt-outs
- Data retention settings honored
- No cookies for tracking
- Privacy-first design