This is a Canvas programming introductory series:
- Canvas Part 1: Introduction
- Canvas Part 2: Transforms and Transparency
- Canvas Part 3: Shadows and Gradient Fill
- Canvas Part 4: Inserting Images and Text
- Canvas Part 5: Interactive Shapes
- Canvas Part 6: Animation
- Canvas Part 7: 2D waves
- Canvas Part 8: A big ball of particles
- Canvas Part 9: Pathfinding
- Canvas Part 10: A simple drawing application
- Canvas Part 11: Saving the canvas result
Table of Contents
The Canvas API provides a means for drawing graphics via JavaScript and the HTML <canvas> element. Among other things, it can be used for animation, game graphics, data visualization, photo manipulation, and real-time video processing.
The Canvas API largely focuses on 2D graphics. The WebGL API, which also uses the <canvas> element, draws hardware-accelerated 2D and 3D graphics.
The Canvas is a drawing surface on which the user can unleash their artistic abilities. The Canvas stands apart from all other HTML elements because it requires JavaScript to work. There is simply no other way to draw shapes or add images. This means that the Canvas is essentially a programming tool, one that allows you to go far beyond the original concept of a native HTML tag.
This article is part of the JavaScript Canvas series where I post experiments, JavaScript generative art, visualizations, Canvas animations, code snippets and how-to’s.
At a first glance, using a Canvas may seem like using MS Paint pasted into a browser window. But if you dig a little deeper, you can see that the Canvas is a key component for a number of graphically advanced applications, including some that you’ve probably already thought of – games, mapping tools, dynamic design, and things you might not think are possible – musical and light performances and emulators of physical processes.
In the not too distant past, creating such applications in a browser was an extremely difficult task. Today, the Canvas suddenly makes all these applications possible, if you’re willing to pay the extra time and brainpower.
Let’s start with a bit of code.
Basic Canvas Features
The <canvas> element provides a workspace for drawing. In terms of markup, this is an extremely simple element with three attributes – id, width and height:
<canvas id="my-canvas" width="600" height="300"></canvas>The id attribute gives this Canvas the unique name required for it to be identified by JavaScript code. The width and height attributes set the width and height of the Canvas in pixels, respectively. They are optional, though, as we can control all <canvas> properties in JavaScript using the id attribute.
Considering the above, Canvas sizes should always be set using the width and height attributes of the <canvas> element, not via CSS. Otherwise, issues with distorted patterns may occur.
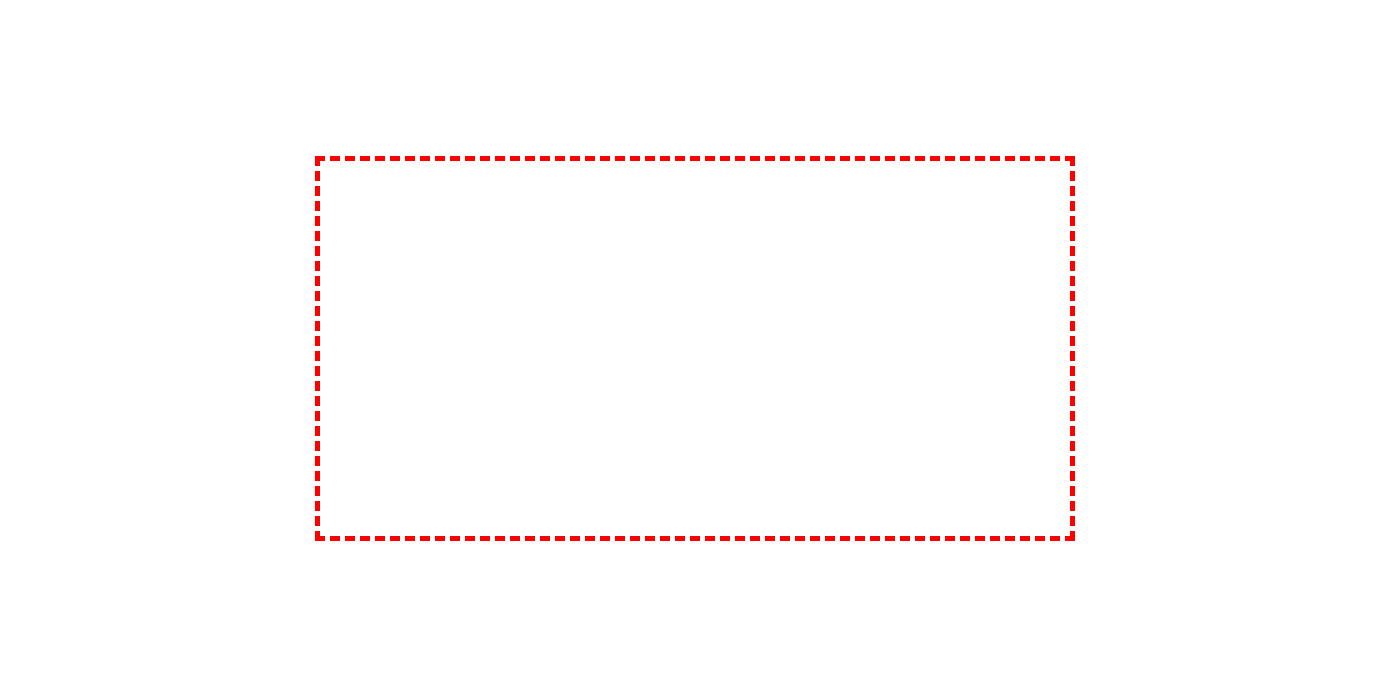
Usually, the Canvas is displayed as an empty rectangle with no border, i.e., it is not visible at all. To make the Canvas visible or to debug it, you can give it a border using:
canvas {
    border: 4px dashed #ff0000; /* A red dashed border */
}
The result, which will be our starting point in the study of Canvas, is shown in the figure below:
To draw on a Canvas, you need JavaScript. This task consists of two stages. The first thing our script needs to do is get the Canvas object using the document.getElementById() method.
Next, you need to get the 2D drawing context using the getContext() method:
let canvas = document.getElementById('my-canvas');
let context = canvas.getContext('2d');
The context can be thought of as a super-powerful drawing tool that performs all the necessary operations for this, such as creating rectangles, typing text, inserting images, and so on. It’s kind of like a one-stop shop for Canvas painting operations.
You can get the context object and start drawing at any time, such as immediately after the page has loaded, when the user clicks the mouse, and so on. The following code shows the code to create such a page template:
<!doctype html>
<html>
<head>
<meta charset="utf-8">
<title>HTML5 Canvas Example</title>
<style>
canvas {
    border: 4px dashed #ff0000;
}
</style>
<script>
window.onload = () => {
    let canvas = document.getElementById('my-canvas');
    let context = canvas.getContext('2d');
}
</script>
</head>
<body>

<canvas id="my-canvas" width="600" height="300"></canvas>

</body>
</html>
Using CSS, we create a border for the Canvas element to indicate its location on the page. And, using JavaScript, we initialize the Canvas API using the window.onload event, which occurs after the page is completely loaded by the browser. The code then receives the Canvas object and creates a drawing context, thus preparing for drawing. This markup can be used as a starting point for further experimentation with the Canvas.
Straight Lines
Now we are ready to start drawing.
The top left point of the Canvas, called the origin, is (0, 0). So for our 600×300 pixel Canvas, the coordinates of the end point (lower right corner) of the Canvas would be (600, 300).
The simplest shape you can draw on a Canvas is a straight line. To do this, you need to perform three actions with the context. First, you need to specify the starting point of the line using the moveTo() method. Then, using the lineTo() method, set the end point of the line. Finally, the stroke() method actually draws the line:
context.moveTo(10, 10);
context.lineTo(400, 40);
context.stroke();
From the point of view of ordinary drawing, these actions can be considered as follows: first, we set the starting point of the line with a pencil (the moveTo() method), then we set the end point (the lineTo() method), and, finally, we actually draw the line, connecting its start and end points (the stroke() method). As a result, the points (10, 10) and (400, 40) are connected by a one-pixel thick line.
Fortunately, the line style can be varied. At any point in drawing a line, but before calling the stroke() method, three properties of the drawing context can be set: lineWidth, strokeStyle, and lineCap. These properties remain in effect until changed.
The lineWidth property specifies the width of the line in pixels. For example, the following line of code sets the line width to 10 pixels:
context.lineWidth = 10;The strokeStyle property determines the color of the lines. The value of this property can be an HTML color name, an HTML color code, or the rgb() CSS function, which allows you to create a color from its red, green, and blue components:
context.strokeStyle = "rgb(16, 155, 252)";The strokeStyle property is called like that, and not strokeColor, because it allows you to set not only pure colors but also gradient fills or patterns of images.
Finally, the lineCap property specifies the type of line caps. By default, this property is set to butt (which makes the ends of the line rectangular), but you can also set it to round, making the ends round, and square. The latter also makes the ends of the line rectangular, like the butt value, but lengthens it at each end by half the line’s thickness value. In the same way, the line lengthens with the shape of the ends round.
The following is the code to draw three horizontal lines, each with its own end style:
// Thickness and color
context.lineWidth = 20;
context.strokeStyle = 'rgb(16, 155, 252)';

// Line with butt ends
context.moveTo(10, 50);
context.lineTo(400, 50);
context.stroke();

// Line with round ends
context.beginPath();
context.moveTo(10, 120);
context.lineTo(400, 120);
context.lineCap = 'round';
context.stroke();

// Line with square ends
context.beginPath();
context.moveTo(10, 190);
context.lineTo(400, 190);
context.lineCap = 'square';
context.stroke();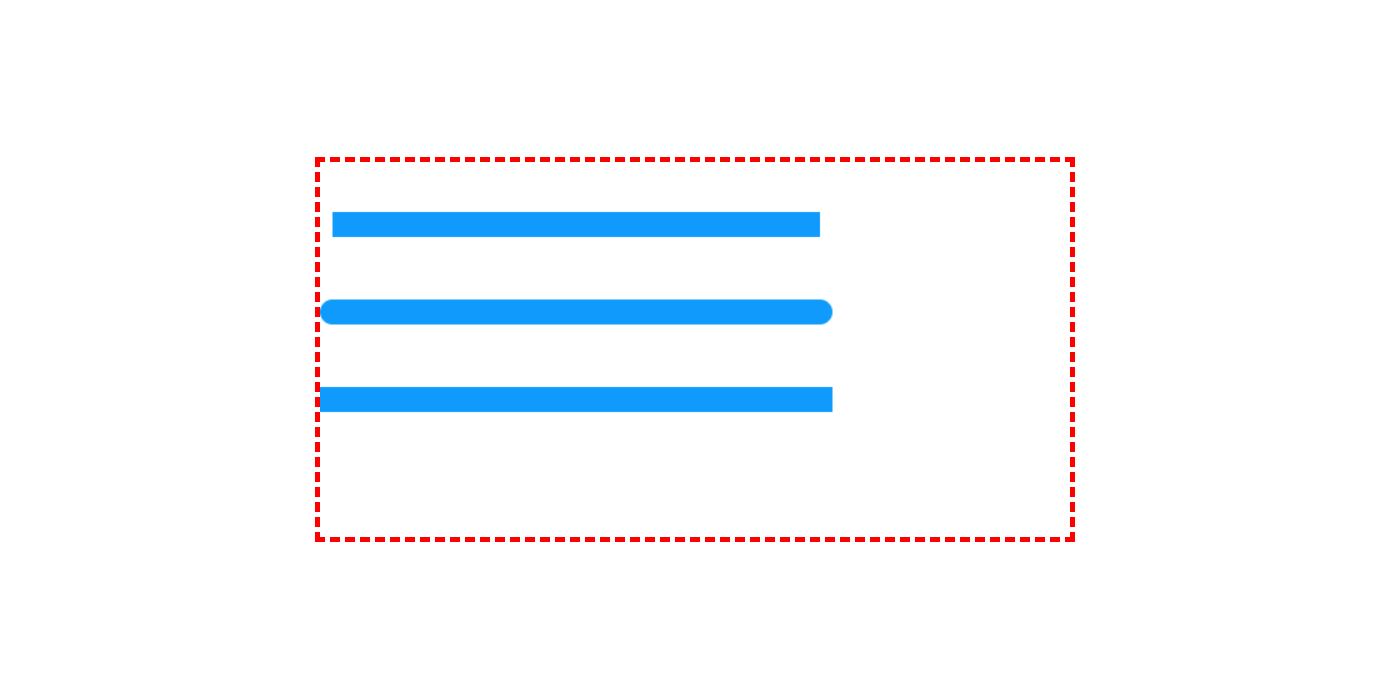
The top line has standard butt-type rectangular ends, and the ends of the other two have added tips (rounded and rectangular) that extend these lines by half their thickness.
This example introduces a new feature: the beginPath() method of the drawing context. A call to the beginPath() method starts a new, separate drawing path. If you don’t follow this step, then every time you call the stroke() method, the Canvas will draw everything again.
To start a new path, you need to call the beginPath() method, and to end the path, nothing special needs to be done. The current path is automatically considered complete as soon as a new path is created.
Paths and Shapes
In the previous example, to separate the lines from each other, a new path was created for each of them. This approach allows you to assign each line its own color, as well as the thickness and type of termination. Paths are also important because they allow you to fill shapes with color. For example, let’s draw a triangle with red lines using the following code:
context.moveTo(250, 50);
context.lineTo(50, 250);
context.lineTo(450, 250);
context.lineTo(250, 50);

context.lineWidth = 10;
context.strokeStyle = 'red';
context.stroke();
Now we want to paint the inside of this triangle, but the stroke() method is not suitable for this task. Here you need to close the current path with the closePath() method, select the fill color by setting the value of the fillStyle property, and then call the fill() method to actually perform the fill.
In this example, it is worth making a couple of adjustments.
First, when closing the path, there is no need to draw the last segment of the line, because calling the closePath() method automatically draws a line between the last drawn point and the starting point.
Second, it is better to first fill the shape and only then outline its contours. Otherwise, the contour lines may be partially covered by the fill.
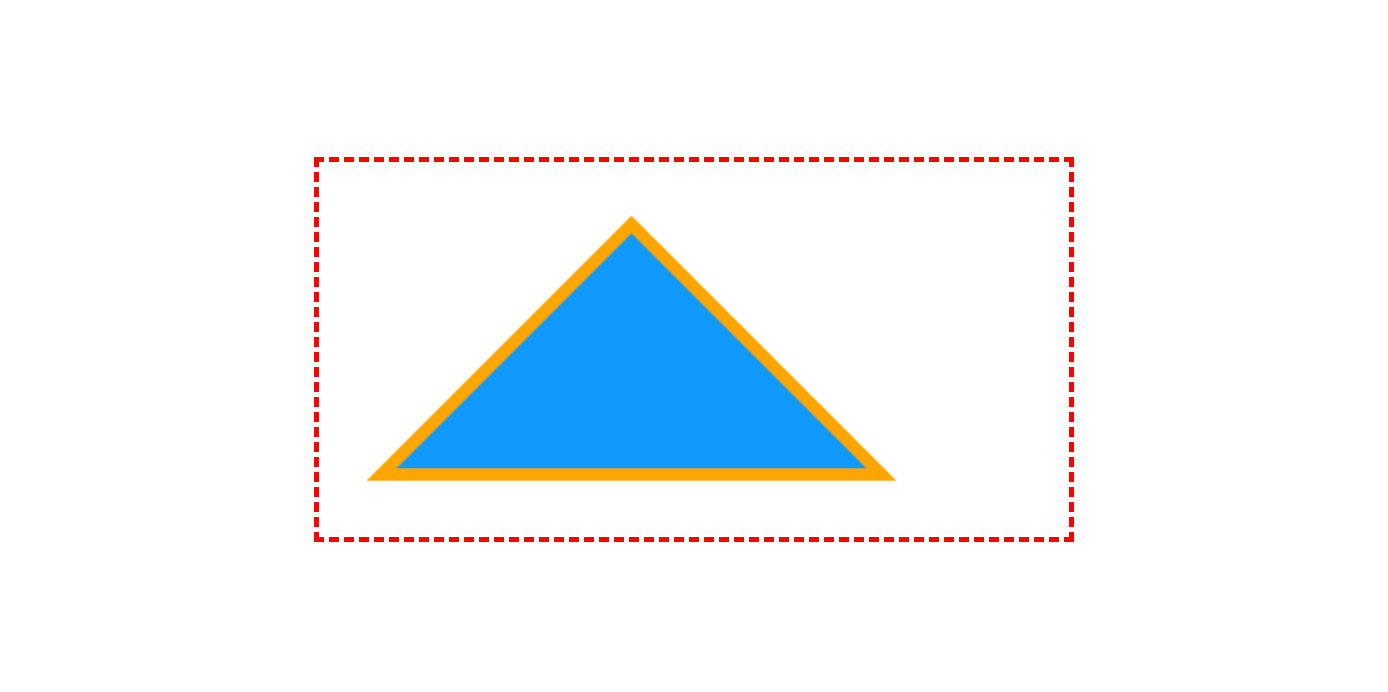
The following is the complete code for drawing and filling a triangle:
context.moveTo(250, 50);
context.lineTo(50, 250);
context.lineTo(450, 250);
context.closePath();

context.fillStyle = '#109bfc';
context.fill();

context.lineWidth = 10;
context.strokeStyle = 'orange';
context.stroke();
Note that in this example, the beginPath() method does not need to be called, the path is generated automatically. The beginPath() method should only be called when a new path needs to be started, such as when changing the parameters of a line or a new shape. The results of the code above are shown in the figure below:
Shape vertices created by joining lines can be styled in three different ways by setting the lineJoin context property to the appropriate values. The round value rounds the vertices, the miter value connects the lines at the vertex “under the moustache”, and the bevel value cuts the vertices with a straight line. By default, the lineJoin property is set to miter.
In most cases, to create a complex shape, its outlines must be created step by step, one line at a time. But one shape is important enough to have its own method. This is a rectangle. You can fill a rectangular area with a fill in one step using the fillRect() method, which is passed the coordinates of the upper left corner, the width, and height of the rectangle as parameters. In one go, using the strokeRect() method, you can also draw the outline of a rectangle.
The fill color for the fillRect() method is set in the same way as for the fill() method by the fillStyle property. The thickness and color of the rectangle’s lines are determined by the current values of the lineWidth and strokeStyle properties, just like for the stroke() method.
For example, the following code fills a 100×200 pixel rectangular area with the top-left corner at (100, 40):
context.fillStyle = '#109bfc';
context.strokeStyle = 'orange';
context.lineWidth = 10;
context.fillRect(100, 40, 100, 200);
context.strokeRect(100, 40, 100, 200);
Curved Lines
To draw something more complex than lines and rectangles, you need to learn the following four methods: arc(), arcTo(), bezierCurveTo() and quadraticCurveTo(). All of these methods draw curved lines, and although each does it differently, they all require at least a little (and some more) knowledge of mathematics.
Of all these methods, the simplest is the arc() method, which draws an arc. To draw an arc, you first need to imagine a full circle in your mind, and then decide which part of its circle you want to draw. The arc looks like a fairly simple figure, but to fully describe it, several pieces of information are required. First, you need to draw an imaginary circle. To do this, you need to know the coordinates of the center and the radius, which determines the size of the circle. Next, you should describe the length of the arc on the circle, which requires the angle of the beginning of the arc and the angle of its end. The angle values must be in radians, which are expressed in terms of the number π. The angle of the whole circle is 2π, half of it is 1π, and so on.
Having collected all the necessary data, we pass them to the arc() method:
context.lineWidth = 20;
context.strokeStyle = 'rgb(16, 155, 252)';

let centerX = 150;
let centerY = 200;
let radius = 100;
let startingAngle = 1.25 * Math.PI;
let endingAngle = 1.75 * Math.PI;

context.arc(centerX, centerY, radius, startingAngle, endingAngle);
context.stroke();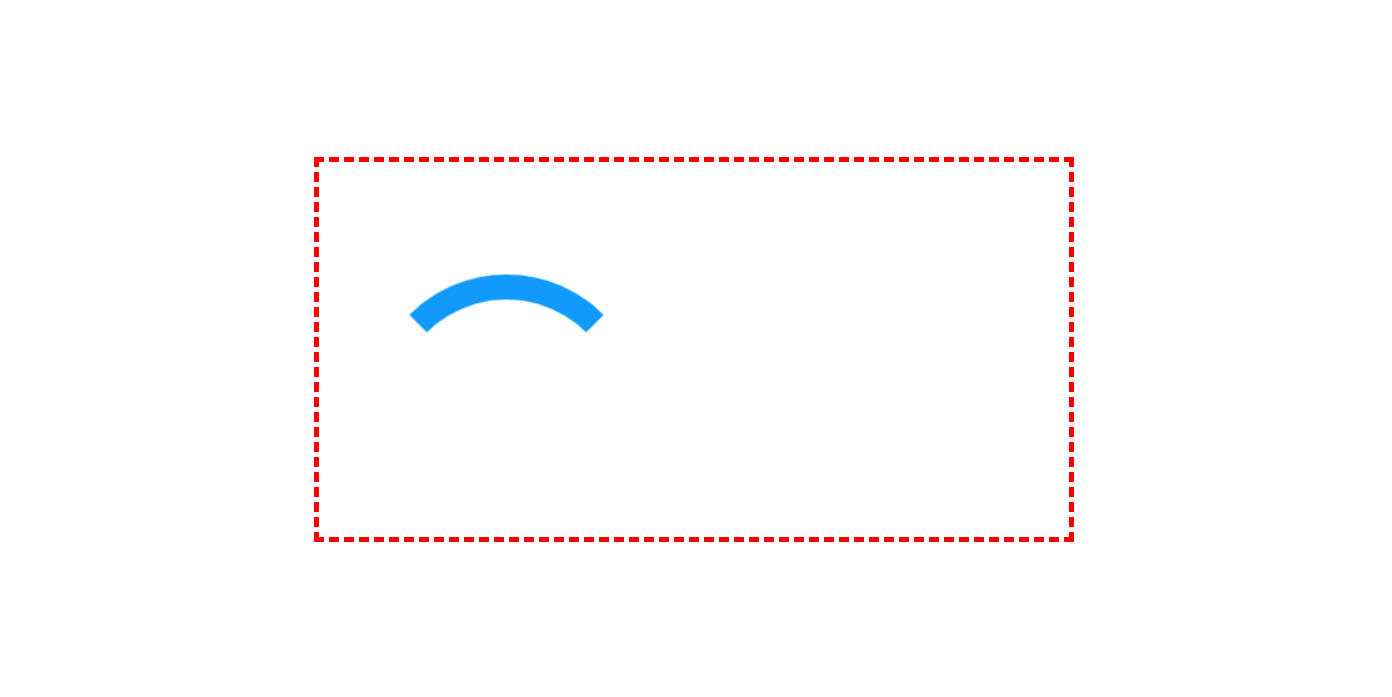
The arc can be closed by connecting its ends with a straight line. To do this, call the closePath() method before calling the stroke() method. By the way, a circle is the same arc, just with an angle of 2π. The circle is drawn like this:
let startingAngle = 0;
let endingAngle = 2 * Math.PI;
The arc() method cannot be used to draw an oval (extended circle). To do this, you need to use either more complex methods for drawing curves, or apply transformations.
The other three methods for drawing curves – arcTo(), bezierCurveTo(), and quadraticCurveTo() – can be a bit tricky for those not comfortable with geometry. They are based on the principle of control points, i.e., points that are not themselves part of the curve, but control its shape. The best-known type of such curves are Bézier curves, which are used in almost every drawing program. The reason for the popularity of this method is its ability to create smooth curves, regardless of their size.
The Bézier curve is created by the following code:
context.lineWidth = 10;
context.strokeStyle = 'rgb(16, 155, 252)';

context.moveTo(62, 242);

let controlX_1 = 187;
let controlY_1 = 32;
let controlX_2 = 429;
let controlY_2 = 480;
let endPointX = 365;
let endPointY = 133;

context.bezierCurveTo(controlX_1, controlY_1, controlX_2, controlY_2, endPointX, endPointY);
context.stroke();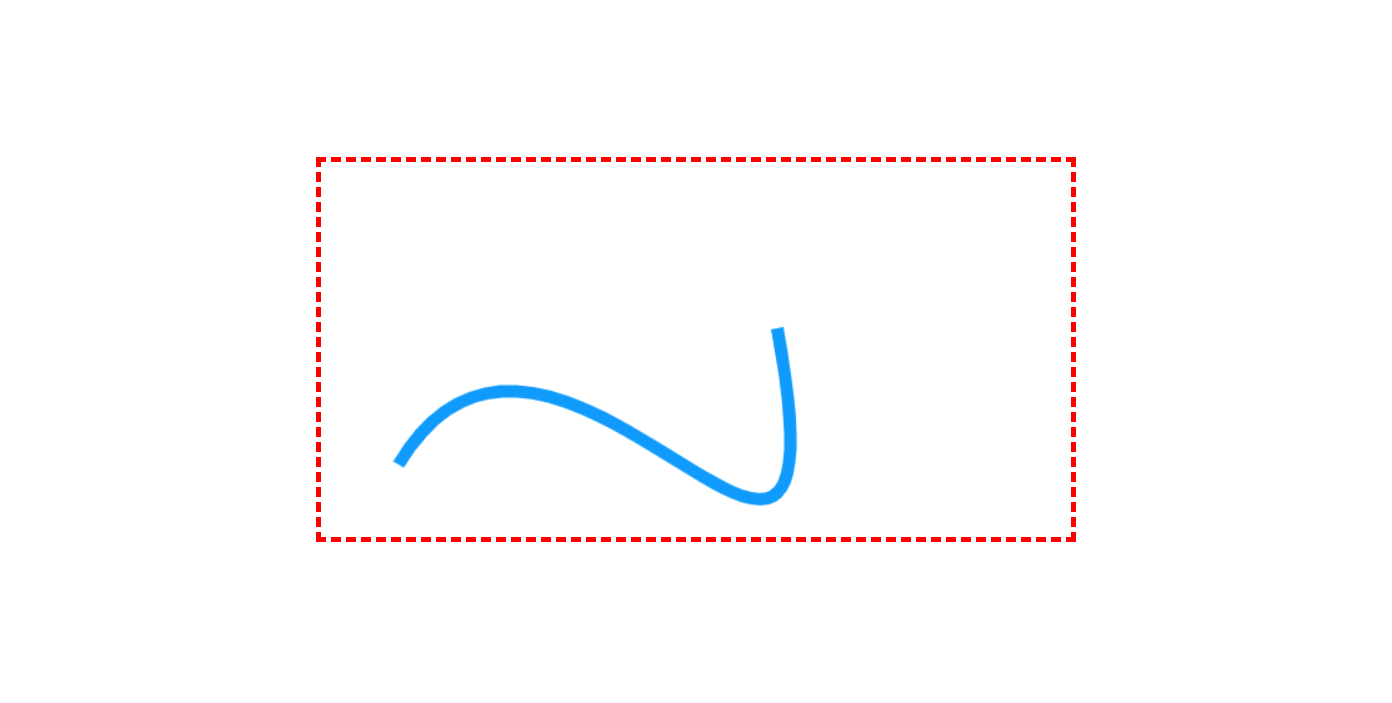
The outline of a complex figure often consists of a series of arcs and curves that connect to each other. When you have finished drawing all the components, you can call the closePath() method to stroke or fill the entire shape. To learn more about Bézier curves, it’s best to experiment with them.
This demonstration shows how Bézier curves can be drawn on a Canvas element. Drag the line ends, or the control points to change the curve.
See the Pen Canvas Bézier Curves by Ciprian (@ciprian) on CodePen.