
Create a Segmented Horizontal Bar Chart with Vanilla JavaScript
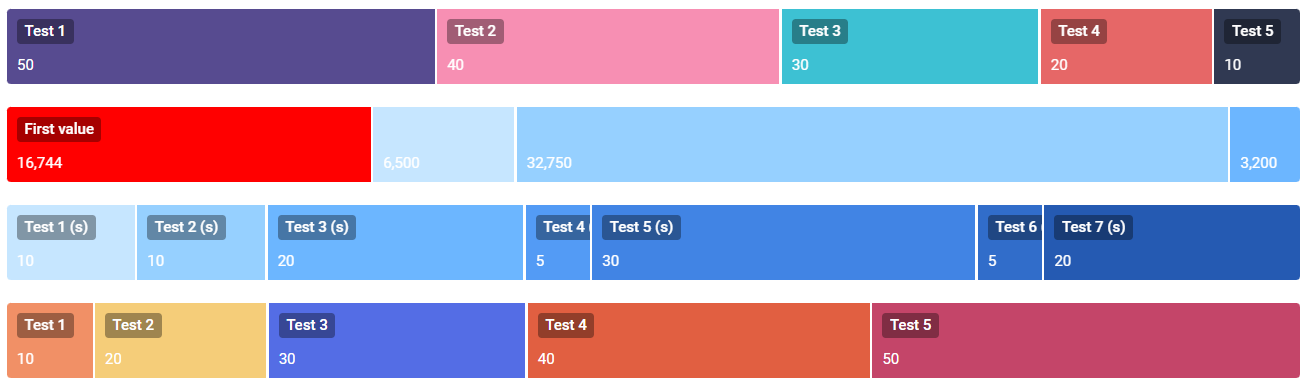
In the world of complex charts and graph libraries, sometimes you want a simple, lightweight solution that doesn’t rely on external dependencies. If you’re looking to create a segmented (stepped) horizontal bar chart, you’re in luck! Here’s what we’re going to build:
Introducing Segment
Segment is a tiny JavaScript library designed specifically for generating segmented horizontal bar charts. With Segment, you can easily visualize data and compare multiple datasets using plain HTML and JavaScript.
What is a Segmented Horizontal Bar Chart?
A segmented horizontal bar chart is a type of graph that displays percentages as segments within a specified interval. Each segment represents a single data point, making it a visually effective way to convey information.
How to Get Started
To start creating your own segmented horizontal bar chart with Segment, keep reading:
Include the JavaScript library:
<script src="/path/to/segment.js"></script>
<style src="/path/to/segment.css"></style>
The segment.js file contains the code below:
const SEGMENT_WIDTH = "100%";
const SEGMENT_HEIGHT = "60px";
const palette = [
    "#c6e6ff",
    "#96d0ff",
    "#6cb6ff",
    "#539bf5",
    "#4184e4",
    "#316dca",
    "#255ab2",
    "#1b4b91",
    "#143d79",
    "#0f2d5c"
];

function buildSegmentBar(element, options) {
    let percentages = getSegmentPercentages(options.data);

    for (let i = 0; i < options.data.length; i++) {
        options.data[i].percent = +percentages[i];
    }

    element.style.width = options.width ? options.width : SEGMENT_WIDTH;
    element.style.height = options.height ? options.height : SEGMENT_HEIGHT;
    element.classList.add("segment-bar");
    let colorIt = getSegmentNextColor();

    for (let item of options.data) {
        let div = document.createElement("div");

        // Prepare wrapper
        div.style.width = `${parseFloat(item.percent * 100)}%`;
        div.style.backgroundColor = item.color
            ? item.color
            : colorIt.next().value;
        div.classList.add("segment-item-wrapper");

        // Percentage span
        let span = document.createElement("span");
        span.textContent = `${prettifySegmentPercentage(item.percent * 100)}%`;
        span.classList.add("segment-item-percentage");

        // Value span
        let valueSpan = document.createElement("span");
        valueSpan.textContent = `${item.value.toLocaleString("en-US")}`;
        valueSpan.classList.add("segment-item-value");

        // Title span
        if (item.title && item.title.length > 0) {
            let titleSpan = document.createElement("span");
            titleSpan.textContent = item.title;
            titleSpan.classList.add("segment-item-title");
            div.appendChild(titleSpan);

            div.title = `${item.title} (${item.value})`;
        }

        div.appendChild(span);
        div.appendChild(valueSpan);
        element.appendChild(div);
    }
}

function prettifySegmentPercentage(percentage) {
    let pretty = parseFloat(percentage).toFixed(2);
    let v = pretty.split(".");
    let final = 0;
    if (v[1]) {
        let digits = v[1].split("");
        if (digits[0] == 0 && digits[1] == 0) {
            final = parseFloat(`${v[0]}`);
        } else {
            final = pretty;
        }
    } else {
        final = parseFloat(v[0]);
    }
    return final;
}

// Accepts an array of chart data, returns an array of percentages
function getSegmentPercentages(data) {
    let sum = getSegmentSum(data);

    return data.map(function (item) {
        return parseFloat(item.value / sum);
    });
}

// Accepts an array of chart data, returns the sum of all values
function getSegmentSum(data) {
    return data.reduce(function (sum, item) {
        return sum + item.value;
    }, 0);
}

function* getSegmentNextColor() {
    let i = 0;
    while (true) {
        yield palette[i];
        i = (i + 1) % palette.length;
    }
}
The segment.css file contains the code below:
.segment-bar * {
    box-sizing: border-box;
}
.segment-bar {
    font-family: Roboto;
    display: flex;
    flex-wrap: nowrap;
    gap: 2px;
}
.segment-item-wrapper {
    display: inline-flex;
    height: 100%;
    padding: 0 4px;
    position: relative;
    overflow: hidden;
    transition: padding 0.6s cubic-bezier(0.83, 0, 0.17, 1);
}
.segment-item-wrapper:first-child {
    border-radius: 3px 0 0 3px;
}
.segment-item-wrapper:last-child {
    border-radius: 0 3px 3px 0;
}
.segment-item-percentage {
    opacity: 0;
    color: white;
    position: absolute;
    bottom: 8px;
    right: 8px;
    font-size: 12px;
    font-family: monospace;
    transition: opacity 0.6s cubic-bezier(0.83, 0, 0.17, 1);
}
.segment-item-wrapper:hover {
    z-index: 1;
    box-shadow: inset 0 0 0 60px rgba(0, 0, 0, 0.25);
    padding: 0 128px;
}
.segment-item-wrapper:hover .segment-item-percentage {
    opacity: 1;
}
.segment-item-title {
    display: inline-block;
    background-color: rgba(0, 0, 0, 0.35);
    line-height: 1;
    padding: 4px 6px;
    border-radius: 3px;
    white-space: nowrap;
}
.segment-item-value {
    color: white;
    position: absolute;
    bottom: 8px;
    left: 8px;
    font-size: 12px;
}
.segment-item-title {
    position: absolute;
    left: 8px;
    top: 8px;
    color: white;
    font-size: 12px;
    font-weight: 500;
}
The HTML could not be simpler!
<div class="" id="chart1"></div><br>
<div class="" id="chart2"></div><br>
Here’s how you build the values and call the script:
buildSegmentBar(document.getElementById('chart1'), {
    data: [
        {
            title: "First value",
            value: 16744,
            color: "#ff0000"
        },
        {
            title: "Second value",
            value: 6500,
            color: "#00ff00"
        },
        {
            title: "Third value",
            value: 32750,
            color: "#0000ff"
        },
        {
            title: "Fourth value",
            value: 3200,
            color: "#ffff00"
        }
    ]
});

buildSegmentBar(document.getElementById('chart2'), {
    data: [
        { title: "Test 1 (s)", value: 10 },
        { title: "Test 2 (s)", value: 10 },
        { title: "Test 3 (s)", value: 20 },
        { title: "Test 4 (s)", value: 5 },
        { title: "Test 5 (s)", value: 30 },
        { title: "Test 6 (s)", value: 5 },
        { title: "Test 7 (s)", value: 20 }
    ]
});
The value parameter is the only mandatory parameter in your data object array. The title and color are optional, but nice to have.
Next, use the CSS included to customize the chart’s appearance and behaviour as needed. I really like the expanding effect on hover.
And that’s it! You now have a beautiful segmented horizontal bar chart powered by vanilla JavaScript.
Here is a CodePen demo:
See the Pen Segmented Horizontal Bar Chart (Graph) by Ciprian (@ciprian) on CodePen.